 |
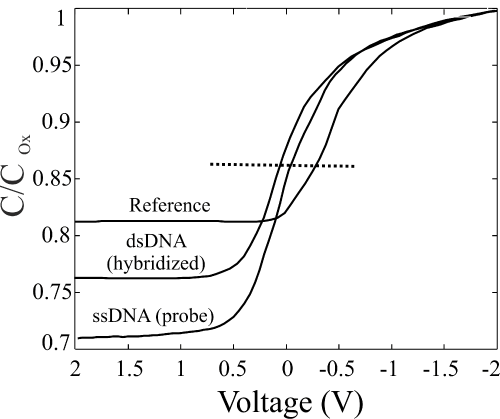
| Figure 6: Normalized Capacitance Voltage curves of the reference sample (upper line on the left), fully processed ssDNA (line in the center on the left) and of the hybridized dsDNA (bottom line on the left). The horizontal dotted line indicates the C/Cox value used to define the ΔV values among the three curves. Each curve is the mean of three sets of measurements each given by 60 repetitions. |