 |
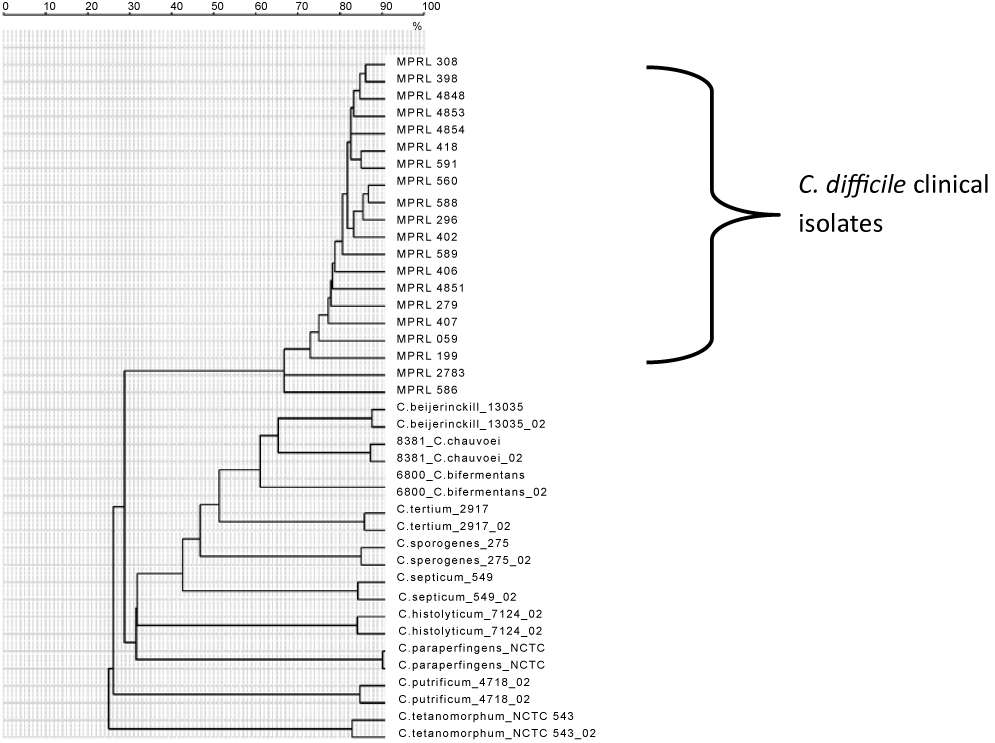
| Figure 3b: Cluster analysis of mass spectral ions in the mass range of 2,000-20,000 Da. Differentiation of clinical isolates of C. difficile from other Clostridium species. The latter showed < 30 % similarity of mass ions thus extending the confidence of identification of C. difficile even among closely related taxa. |