 |
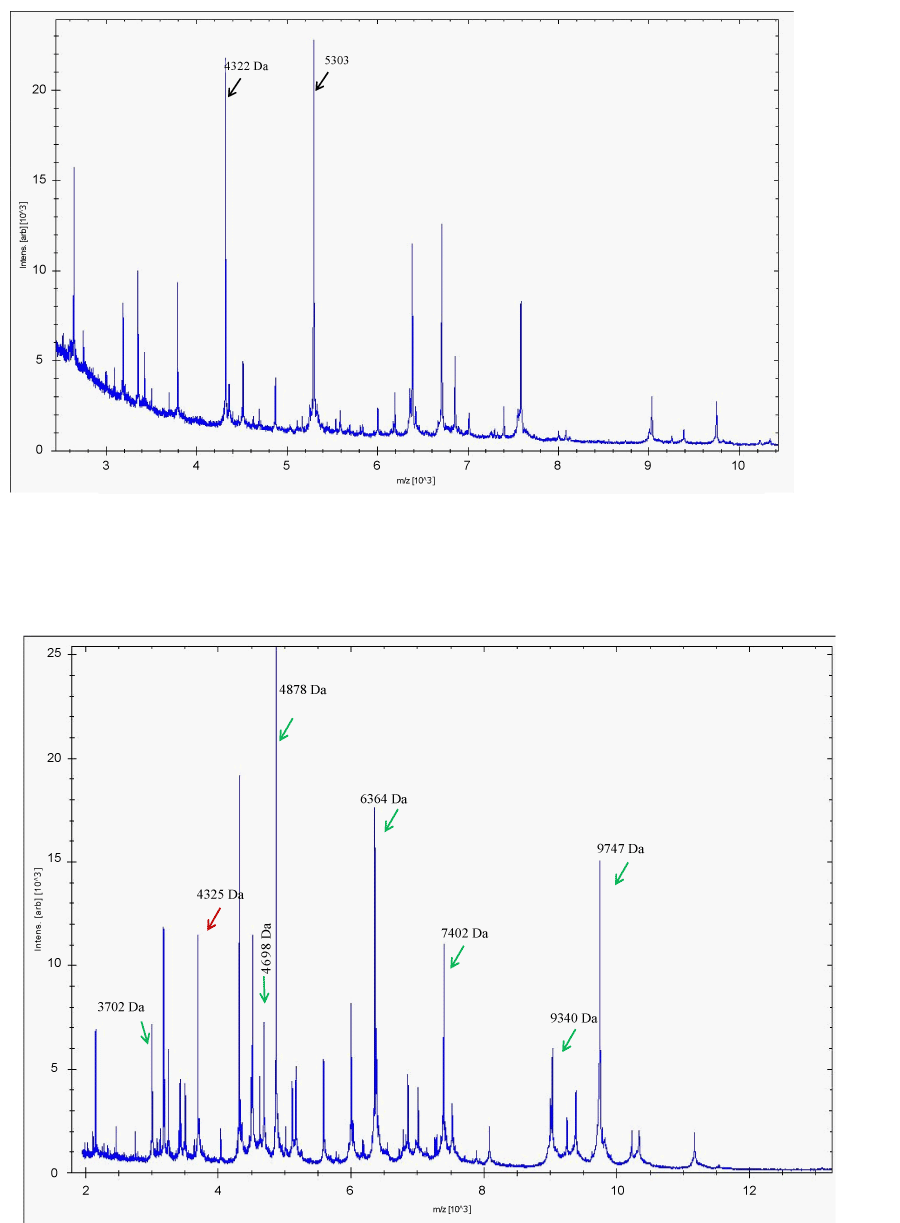
| Figure 4: Mass spectrum of L. monocytogenes derived directly from smeared cell preparations that are overlaid with alpha-cyano-4-hydroxycinnamic acid (CHCA, above) and the mass spectrum derived from formic acid extraction of proteins. Nearly all the spectral ions are with the mass range 2 - 10 kDa in both spectra, however, significantly more mass ions were present in the formic acid extraction which yielded a more confidence for species identification. |