 |
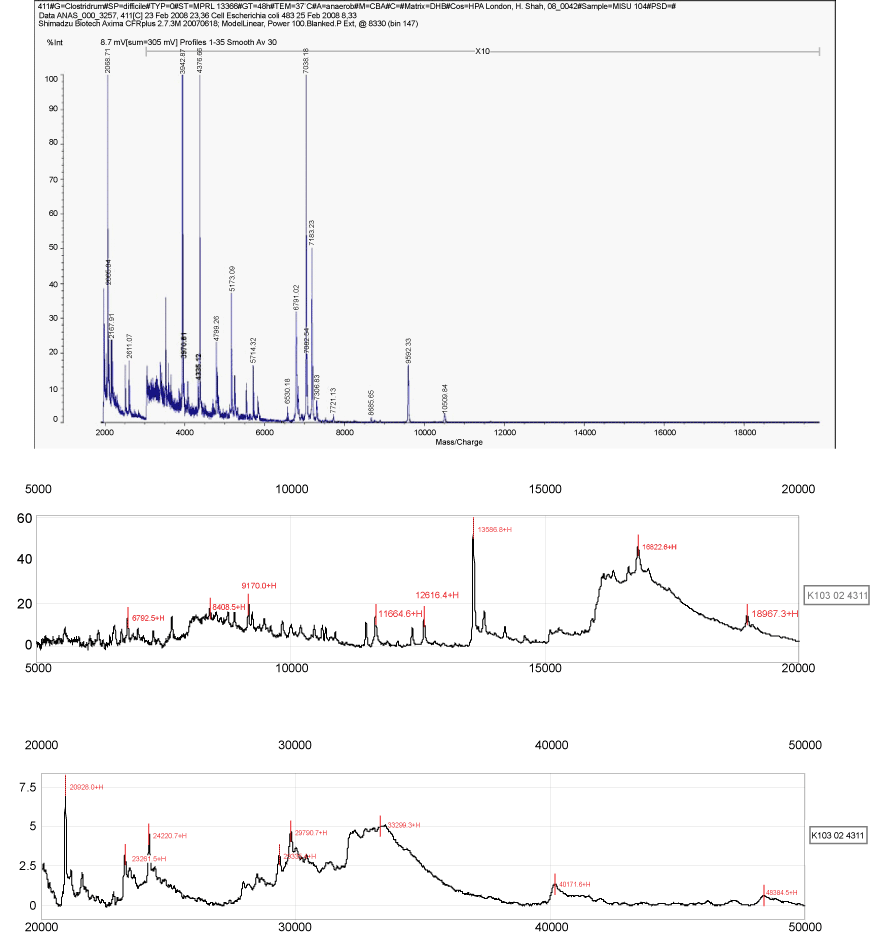
| Figure 5: The distribution of biomarkers in the mass spectrum Propionibacterium acnes. Unlike the spectrum generated using CHCA (Figure 5a), the mass ions derived here using SELDI-TOF-MS spans the range 5 - 50 kDa significantly increasing the number of potential biomarkers for this species. |