 |
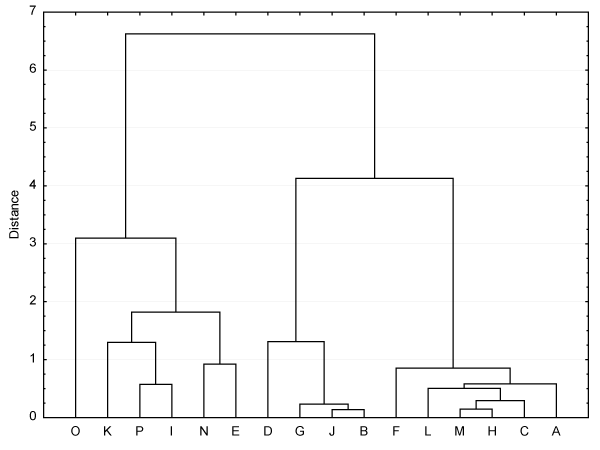
| Figure 1: Grouping dendrogram of similar method for vitamin E analysis in meat (hierarchical clustering analysis) and the process of agglomeration, A - Arnold et al. [31]; B - Berlin et al. [35]; C- Cort et al. [28]; D - Gaal et al. [32]; E - Hatam and Kayden [36]; F - He et al. [26]; G - Jenson et al. [33]; H - Kanazawa et al. [24]; I - Liu et al. [38]; J - McMurray and Blanchflower [34]; K - Miller et al. [39] - without saponification; L - Pfalzgraf et al. [27]; M - Schuep et al. [29]; N - Zaspel and Csallany [37] - without saponification; O - Hewavitharana et al. [30] with modification - without saponification; P - Hewavitharana et al. [30] - without saponification; The actual n=288 (the number of samples included in the chart) was reduced in order to obtain a an easily readable picture. |