 |
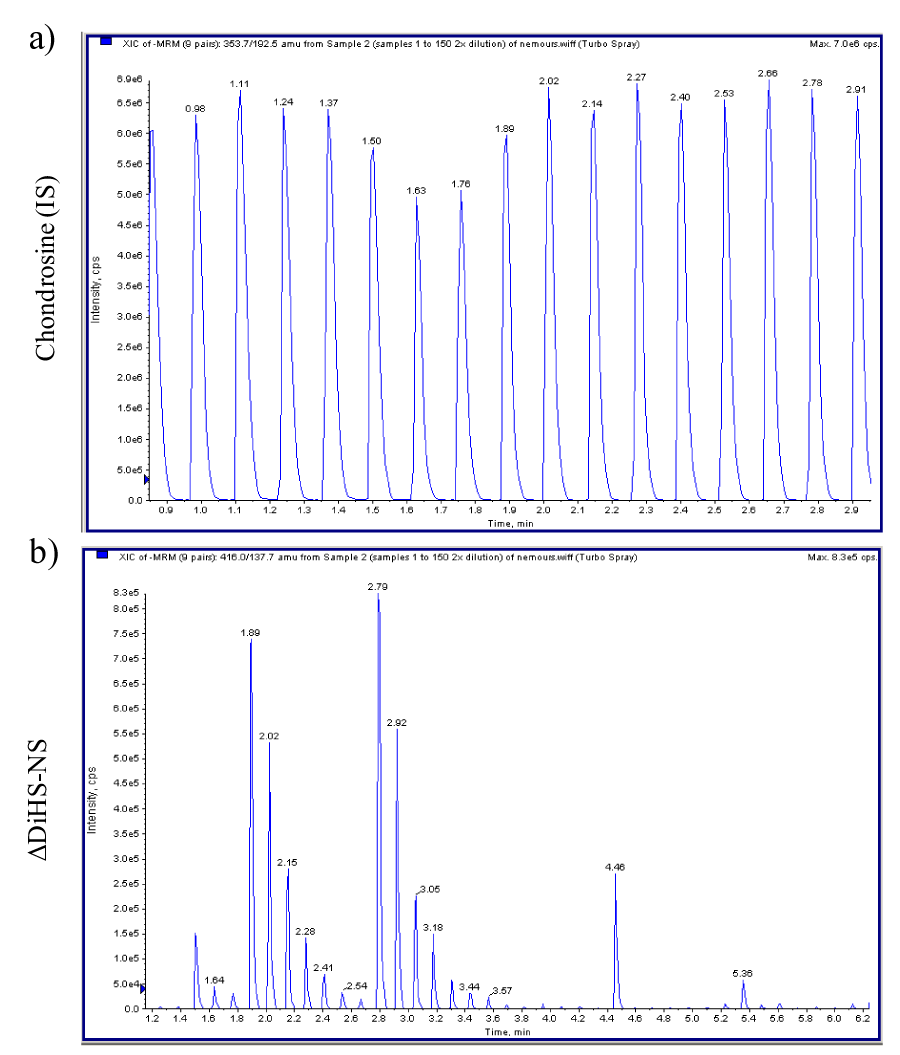
| Figure 7: Chromatograms of RF-MS/MS. a) Multiple injections of chondosine (Q1; 353.7, Q3; 192.5) with the same concentration shows 8 peaks per min. b) Multiple injections of ΔDiHS-NS (Q1; 416.0, Q3; 137.7) with a series of dilutions in duplicate shows seven gradient peaks per a set of dilutions (as well as other surrounding samples). |