 |
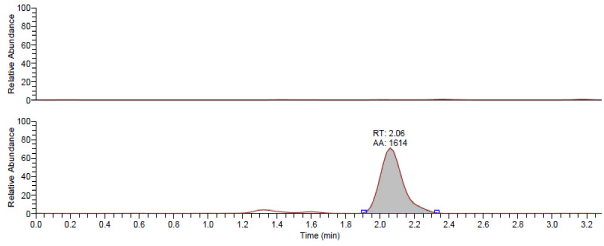
| Figure 4: Stacked total ion chromatograms of pristine leaf extract (top) used as a negative control and three pooled young untreated leaves after 12 hours of treating an older leaf of the same plant with glyphosate (bottom) (both plots are normalized to same scale). |