 |
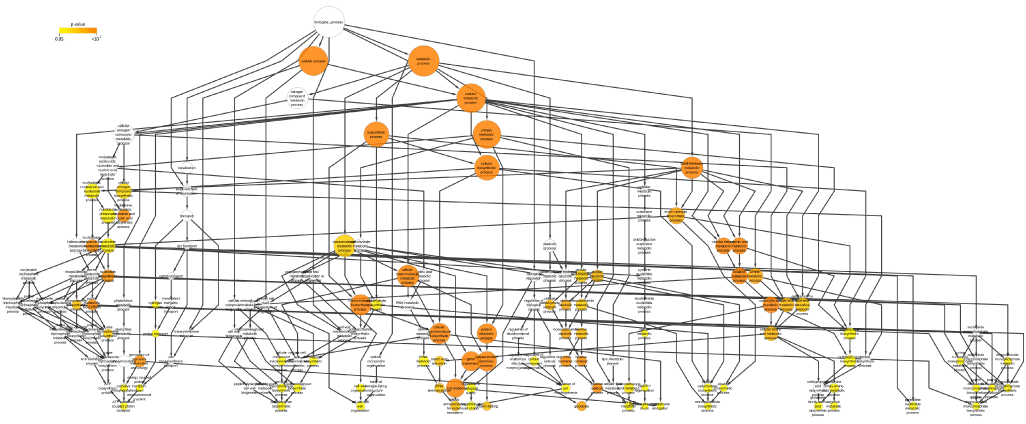
| Figure 3: A graphical illustration of the results of a Gene Ontology analysis performed using BiNGO plugin from Cytoscape tool. The node size is proportional to the number of proteins represented by functional category and color denotes the p-value for each enriched GO term, whereas white nodes are not enriched (a scalable image is given in supplementary table). |