 |
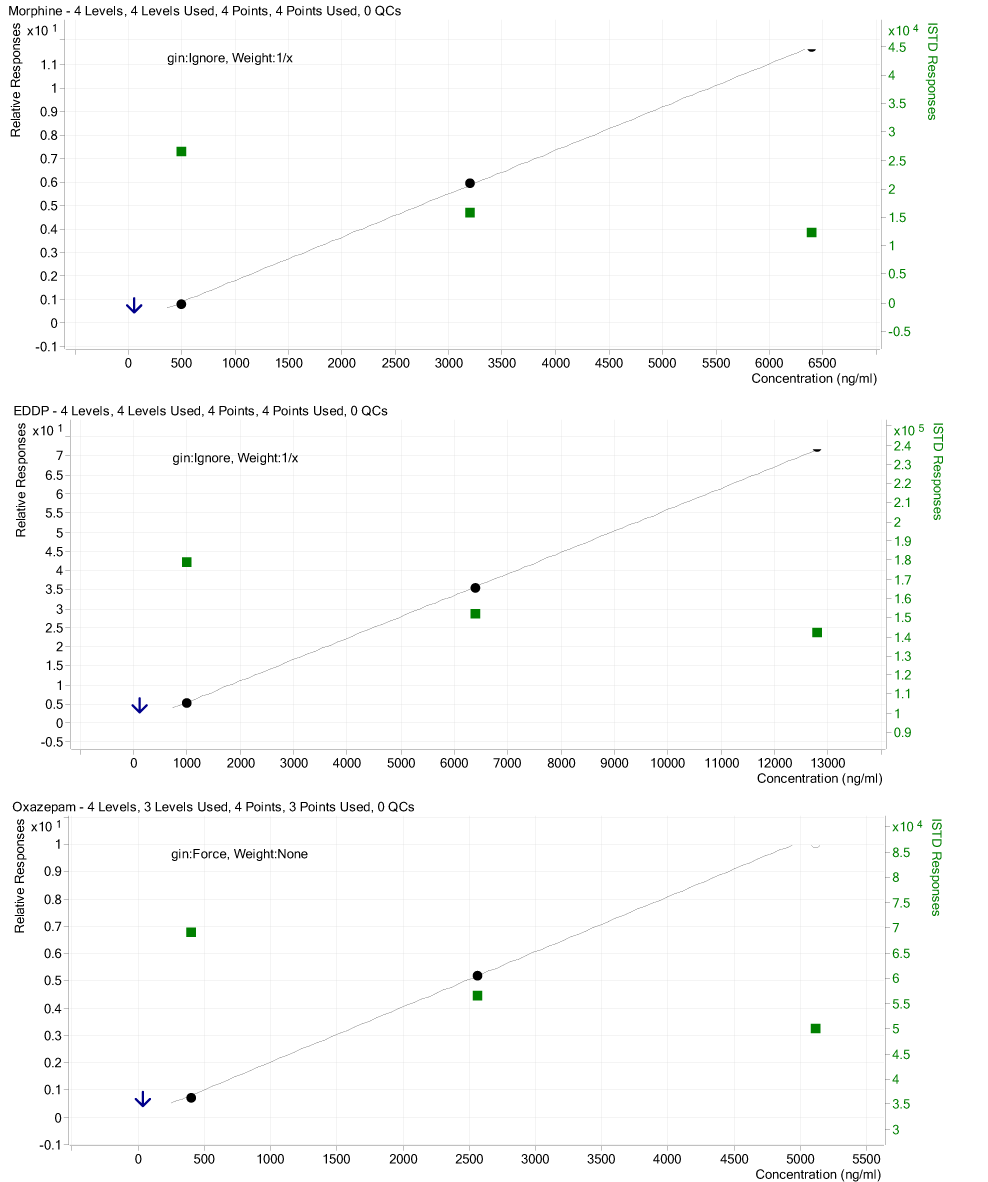
| Figure 2: Ion suppression as a function of concentration. Three analytes morphine, EDDP, and oxazepam were tested at 4 different concentrations as shown in the top middle and bottom graphs. The closed circles are the standard curve obtained from the ratio of the test analyte to its internal standard. The closed squares are the ion responses of the respective internal standards. |