 |
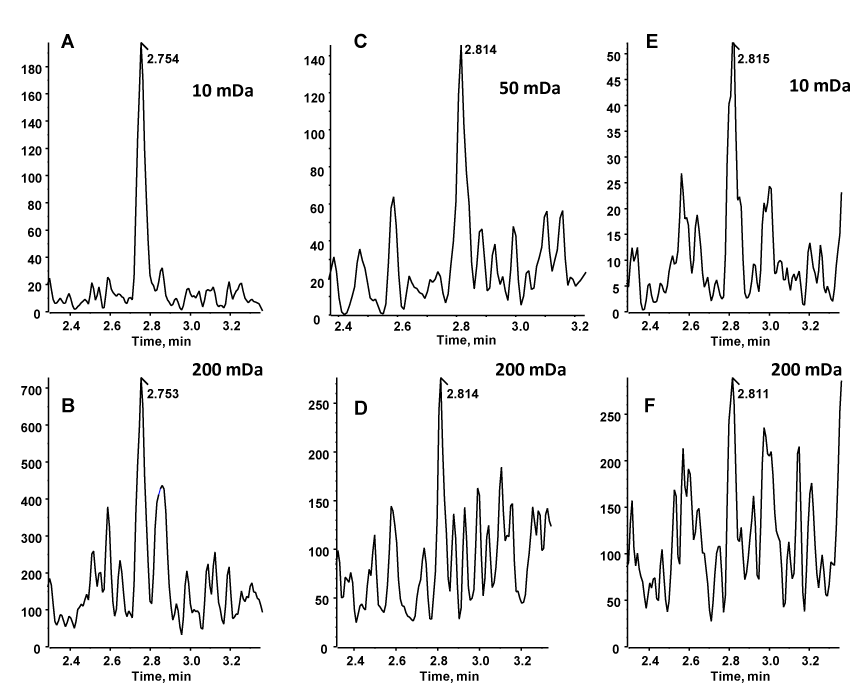
| Figure 6: XIC spectrum of glargine (A and B), M1 (C and D), and M2 (E and F) at lowest concentration of standard curve. Extraction width is labeled on each spectrum. A wider extraction width did not only increase absolute signal of XIC peak but also generated higher background. |