 |
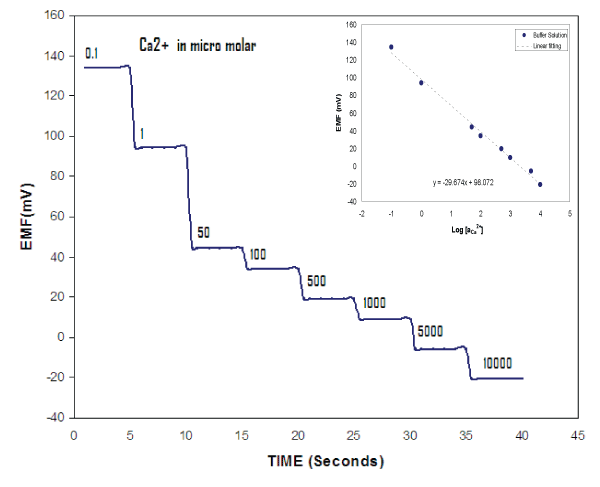
| Figure 4: Sensitivity diagram showing the potentiometric response versus time as the concentrations of Ca2+ solution is changed in the buffer solution surrounding the cell. The Ca2+ concentration was varied from 100nM to 10mM. The inset is a typical calibration curve showing the electrochemical potential difference versus the Ca2+ concentration using the functionalized ZnO nanorods as working electrode and an Ag/AgCl as reference electrode [1]. |