 |
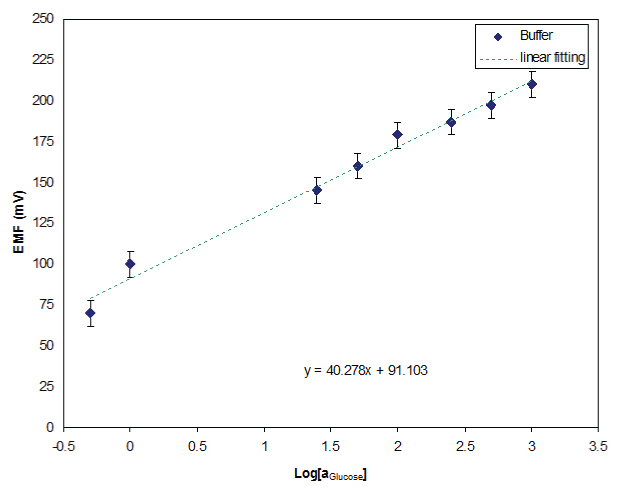
| Figure 6: A calibration curve showing the electrochemical potential difference versus the glucose concentration (0.5-1000ÁM) using functionalised ZnOnanorod- coated probe as a working electrode and an Ag/AgCl microelectrode as a reference microelectrode [5]. |