 |
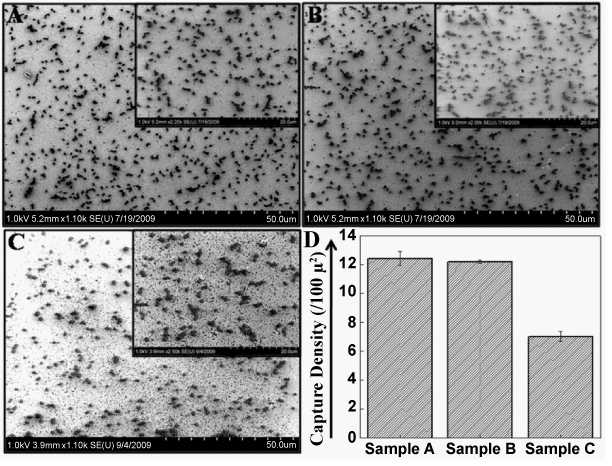
| Figure 2: SEM images of Salmonella captured on the surface of flat Si using (A) randomly immobilized P22 N-Cys mutant TSPs, (B) Cys tag-based immobilized P22 N-Cysmutant TSPs and (C) His6 tag-based immobilized P22 N-Cysmutant TSPs. The inset in all the figures shows a high magnification SEM image of the corresponding samples. (D) Histogram plot of bacterial capture density obtained for randomly (Sample A) and oriented (Sample B,C) TSPs on flat Si surface. The error bars in the histrogram show the standard deviation of the bacterial capture density obtained from counting 8 high magnification SEM images. |