 |
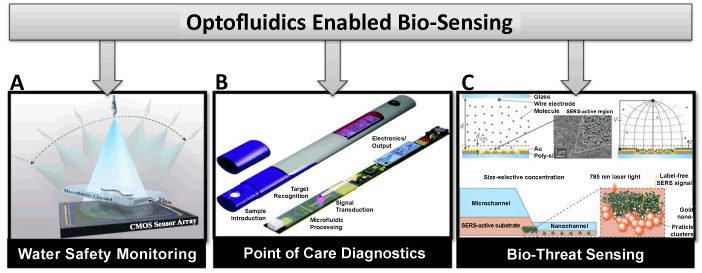
| Figure 4: (A) Schematic diagram of optofluidic tomography setup (Reproduced with permission from the American Institute of Physics) [35], (B) Idealized POC device (Reproduced with permission from John Wiley and Sons, Inc.) [36], (C) SERS-active optofluidic biothreat sensing diagram (Reproduced with permission from Nature Publishing Group) [34]. |