 |
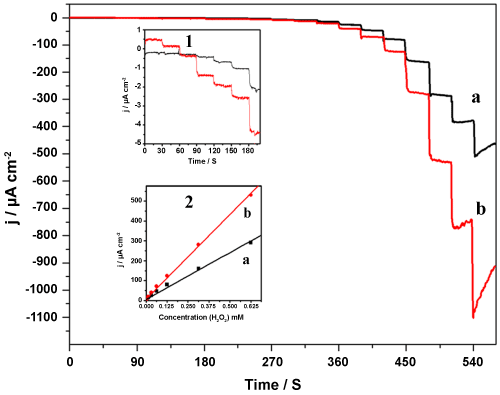
| Figure 8: Amperometric response of PBNPs (a) and graphene-PBNPs (b) modified electrode on the addition of varying concentrations of H2O2 between 0.01 μM - 5 mM at 0.1 V vs AgCl in 0.1 M phosphate buffer, pH 7.0 containing 0.5 M KCl. The insets show the expanded portion of responses (1) and respective calibration plots for H2O2 analysis (2) respectively. |