 |
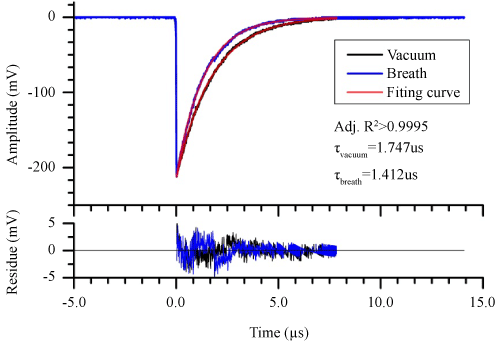
| Figure 2: The evaluation of the ringdown decay behavior. The upper panel shows the ringdown decay waveforms obtained with a vacuumed cavity and with a breath gas sample and their corresponding fitting curves. The lower panel shows the corresponding fitting residues. The fitting segment was selected in a range of ~4τ. |