 |
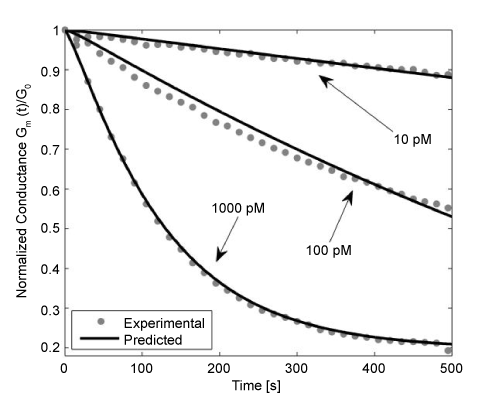
| Figure 3: Experimentally measured and numerically predicted normalized conductance Gm(t)/Go for 1000 pM, 100 pM, and 10 pM concentrations of streptavidin with a biotin antibody receptor is used in the ICS. The numerical predictions are computed using the ICS model in the Materials and Methods section with the parameters defined in Table 1. The experimental data of streptavidin is obtained from [10]. |