 |
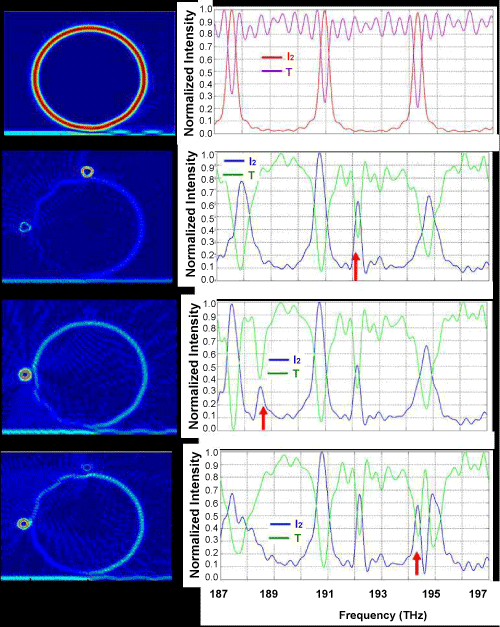
| Figure 7: Light intensity in microring sensor (R=10 μm, dR=1μm, n=1.46).First row: (left) intensity of light with frequency f=192.1 THz in the microring without SO, (right) spectrum of normalized intensity inside cavity I2 (red),and transmission T (purple). Second row: (left) light intensity f=192.2 THz in microring with two identical SOs, n=3.0, (right): spectrum I2 (blue), transmission T (green). Third row: (left) light intensity f=188.6 THz in microring with two SOs n=3.0 and n=3.4, I2 (blue) and transmission T (green).Fourth row: (left) light intensity f=194.4 THz in microring with two SOs n=3.0 and n=3.6, I2 (blue) and transmission T (green). The red arrows indicate the frequency of light intensity in the left figures. |