 |
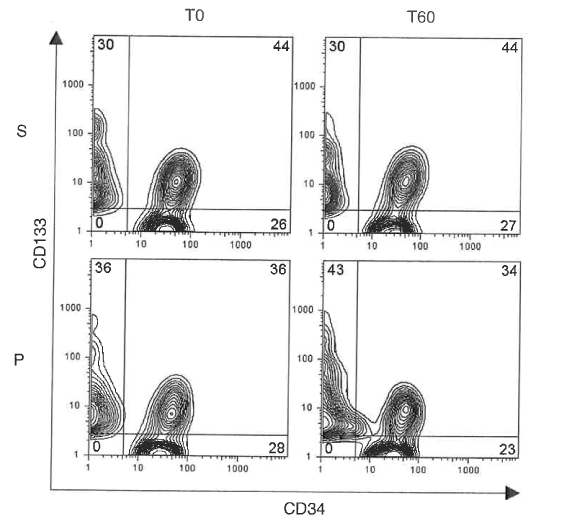
| Figure 6: Contour plots showing the relative distribution CD34+, CD133-, CD34+, CD133-, and CD34-, CD133+ Cells immediately before consumption (T0) and 60 min after consumption (T60) of either StemEnhance(S) or placebo (P). The data shown are representative of one of the 12 study participants. |