 |
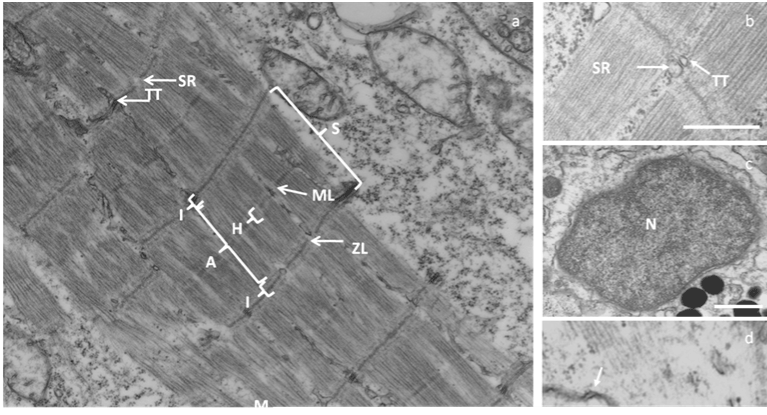
| Figure 2: Electron micrographs of structures in cardiomyocytes of a SCC generated from 350 ATU old larvae. (a) Sarcomeres (S) which are bordered by z-Lines (ZL) and subdivided in I-Band (I: isotrop) and A-Band (A: anisotrop) with H-Zone (H) and M-Line (ML: M: middle of a sarcomere). High concentration on mitochondria (M) is present. Visible is also the Cell membrane (CM) and sarcoplasmic reticula (SR) and T-tubuli (TT). (b) Co-location of SR and TT in the z-Line. (c) Detection of nuclei (N). (d) The transversally orientated sections of the intercalated disk consist of fascia adhaerens (arrows). Scale bar indicates 1 μm. |