 |
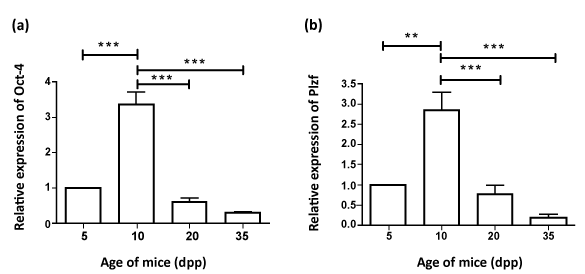
| Figure 2: Real-Time PCR for Oct-4 and Plzf. (a) Expression of Oct-4 (*** indicate statistically significant differences compared to 5 and 10 dpp expression p<0.001) and (b) Plzf (** indicate statistically significant differences compared with 5dpp expression p<0.01, *** indicate statistically significant differences compared with 10 dpp expression p<0.001) transcript levels in the testes of 5, 10, 20 and 35 dpp mice. Mean ± SD, n = 5 mice per age group. |