 |
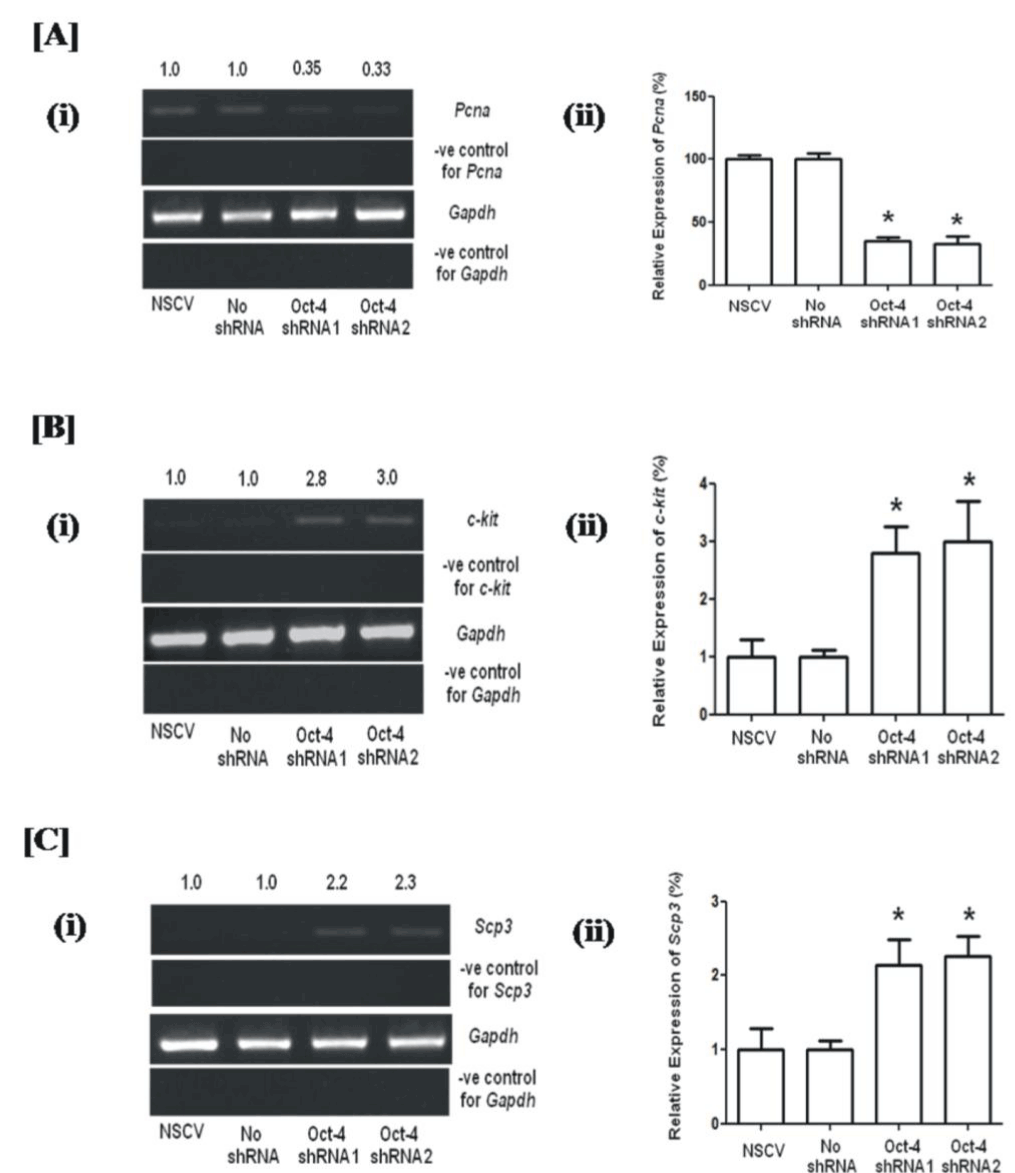
| Figure 4: Effect of Oct-4 knock-down on type A spermatogonial cells in culture. [A] (i) RT-PCR analysis of Pcna and (ii) Relative expression of Pcna mRNA levels quantified by Q-PCR in Oct-4 shRNA treated and untreated cells. [B] (i) RT-PCR analysis of c-kit and (ii) Relative expression of c-kit mRNA levels determined by Q-PCR in Oct-4 shRNA treated and untreated cells. [C] (i) RT-PCR analysis of Scp3 and (ii) Relative expression of Scp3 mRNA levels quantified by Q-PCR in Oct-4 shRNA treated and untreated cells. Negative control did not contain RT enzyme in the reaction mixture. Values are the mean ± SD. n=3 different biological replicates performed on three different occasions (*p<0.05). |