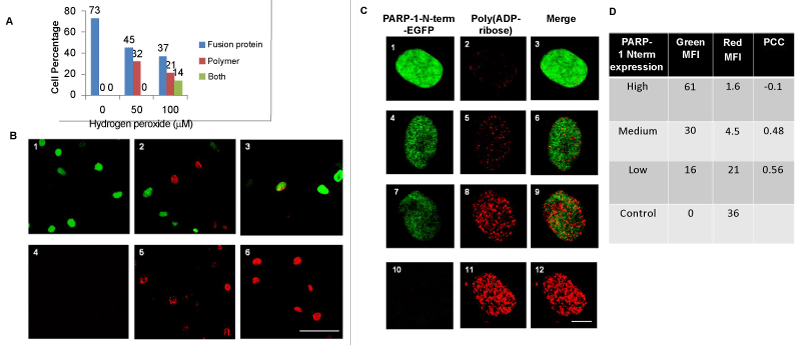
IRK cells stably expressing PARP-1-N-term-EGFP treated with different concentrations of hydrogen peroxide for 5 minutes, fixed, permeabilised and stained for poly(ADP-ribose) using 10H antibody primary antibody and Texas-red conjugated secondary antibody. A. Percentage of cells expressing fusion protein, polymer staining or both. B. Panels 1, 2 and 3, merged images of fusion protein and polymer staining in cells treated with 0, 50 and 100 μM hydrogen peroxide respectively. Panels 4, 5 and 6, Non-transfected cells subjected to identical treatment and stained for poly(ADP-ribose). Scale bar represents 75 μm. C. Panels 1-9, Nuclei of cells presenting PARP-1-N-term-EGFP expression and polymer synthesis at high magnification. Panel 10-12, non-transfected cell treated with 100 μM hydrogen peroxide (control). Scale bar represents 6 μm. Each panel is representative of atleast 60 cells from three separate experiments. D. Mean fluorescence intensities (MFI) of fusion protein and polymer in cells expressing high, medium and low levels of fusion protein. Data is representative of atleast 100 cells from three separate experiments.