 |
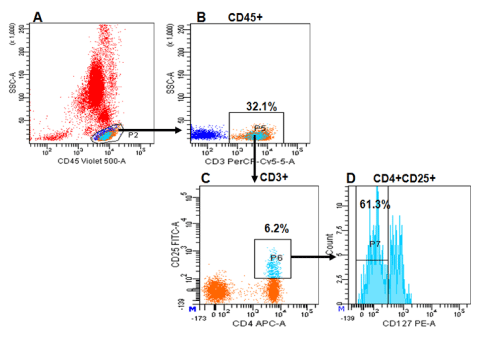
| Figure 1: Phenotypic characterization of Treg cells: Treg cells in donor graft were detected by flow cytometry in a five-color panel, surface labeling of CD45, CD3, CD4, CD25 and CD127 (A) Gate shows CD45+ Mononuclear cells (B) Gate shows CD45+CD3+ T lymphocytes (C) Bivariate dot plot illustrates the CD4+CD25+ phenotype pattern of Treg cells (D) Bivariate dot plot illustrates the CD4+CD25+CD127- phenotype pattern of Treg cells. |