 |
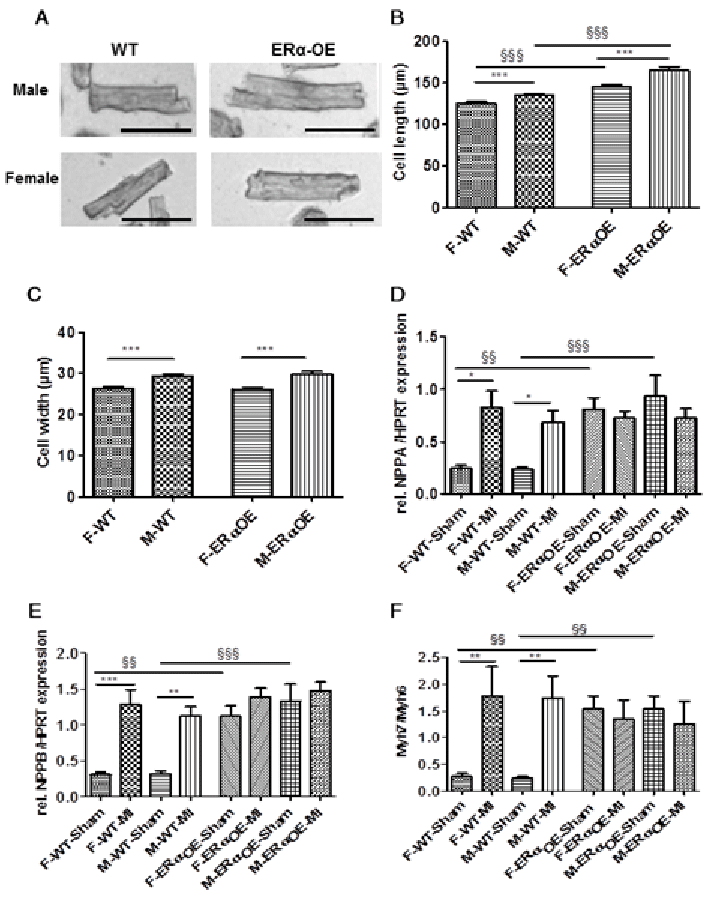
| Figure 2: ERα-overexpression promotes cardiac hypertrophy in the basal state in both sexes. A: Representative micrographs of single cardiomyocytes of WT- and ERα-OE mice (40x magnification, scale bar 100μm). B-C: Quantification of diastolic cell length and cardiomyocytes width. Compared to WT, cardiomyocytes isolated from female and male ERα-OE displayed a significant increase in diastolic cell length, but no changes in cell width at the basal level. Data are given as mean ± SEM for 100 to 300 cells per group. § for the genotype effect (ERα-OE vs. WT, p<0.001); * for females vs. males (p<0.001). D-F: Expression analysis of hypertrophy markers. D: Nppa, E:Nppb, and F: the ratio of Myh7/Myh6 expression in the LV tissues of female and male ERα-OE mice compared with WT-mice. §for the genotype effect (ERα-OE vs. WT, females: p<0.01, p<0.01, p<0.01; males: p<0.001, p<0.001, p<0.01, for each gene). * for MI effect (MI vs. sham, females: p<0.05, p<0.001, p<0.01, males: p<0.05, p<0.01, p0.01,for each gene). n≥10. |