 |
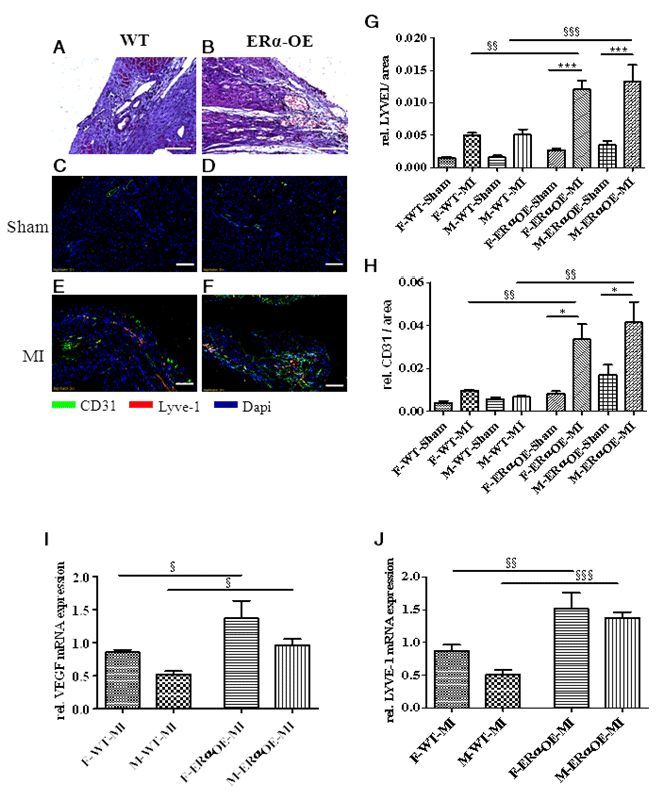
| Figure 4: ERα-overexpression in cardiomyocytes accelerates both angiogenesis and lymphangiogenesis predominantly in the peri-infarct areas in both sexes. A-B: Representative images of H&E-stained paraffin sections of LV tissues from WT- and ERα-OE mice after MI. ERα-OE mice hearts showed an increased occurrence of vascular-like structures in the peri-infarct area. 20x magnification, scale bar 100μm. C-F: Representative immunofluorescence photographs of LV tissues 2 weeks after sham and MI operationfrom WT-(C and E) and ERα-OE (D and F) mice with CD31 and LYVE-1staining (scale bar 100 μm). For a better illustration of CD31 and LYVE- 1 signals, higher magnification of the LV areas with strongest signals, i.e.in the peri-infarct area, have been shown. CD31-positive vessels (green), LYVE-1 positive vessels (red), nuclei (DAPI,blue).G-H:Quantification of areas of LYVE-1 and CD31 expressing vessels fromwhole LV cross-sectional areas.Data expressed as mean ± SEM of 3 to 4 animals per group. § for the genotype effect: females: p<0.01 (LYVE-1), p<0.01 (CD31); males: p<0.001 (LYVE-1), p<0.01 (CD31). * for MI effect: females: p<0.001 (LYVE-1), p<0.05 (CD31); males: p<0.001 (LYVE-1), p<0.05 (CD31). I-J: qRT-PCR analysis of the mRNA levels of Vegf and Lyve-1 in the peri-infarct and infarct areas from WT- and ERα-OE mice. Data expressed as mean ± SEM of 5 to 6 animals per group. § for the genotype effect for each gene: females: p<0.05(Vegf) and p<0.01 (Lyve-1); males: p<0.05(Vegf)and 0.001 (Lyve-1). |