 |
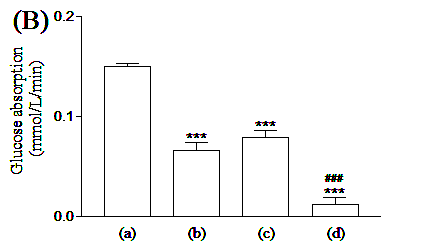
| Figure 5B: Effect of catechin on intestinal glucose absorption in rat. Measured after 30 min; 10 mM Glucose (a); 10 mM glucose plus 1 mM phlorizin (b), 10 mM catechin (c), 1 mM phlorizin plus 10 mM catechin (d). Values are means ± S.E.M.; n=4 animals in each group. ***P< 0.001 compared with control group (a), ###p< 0.001 in relation to phlorizin group |