 |
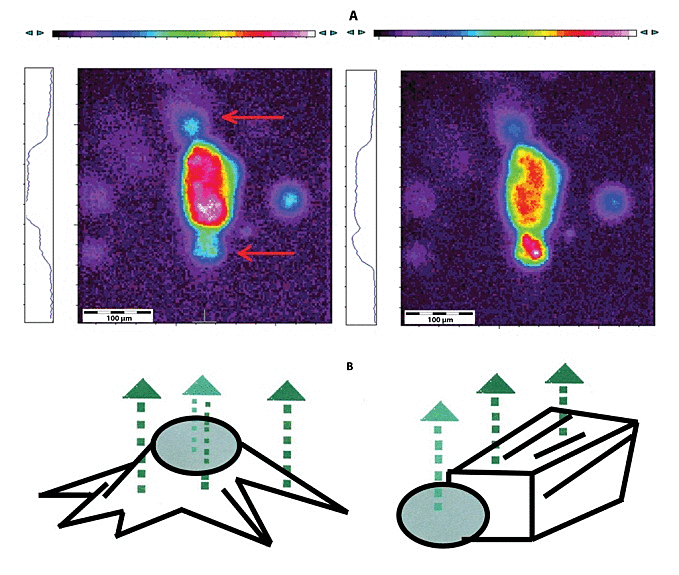
| Figure 5: (A) Fluo-4 loaded BM-MNCs (red arrows) adhered to adult myocytes. Two frames from a video sequence show changes of intensity fluo-4 fluorescence over time (marker of time changes of intracellular Ca2+ concentration) in BM-MNCs and cardiomyocytes. The video sequence shows synchronous changes in intracellular concentration of Ca2+ in BM-MNCs and surrounded cardiomyocytes. The histogram on the left side of the frames shows actual relative intensity of fluorescence from the cells. An Olympus QCL epifluorescence microscope, with objective magnification 60× and camera i-Speed 3 (Olympus, Japan) were used. Pseudocolor transformation was performed (lab software Olympus i-Speed 3). (B) Comparison of BM-MNC adhered to neonatal cardiomyocyte (left picture) and BM-MNC adhered to adult cardiomyocyte (right picture); green arrows represent fluorescence originated from fluo-4 in cytoplasm of the cells. In the case of neonatal cardiomyocytes, part of the fluorescence from CMs goes through the BM-MNC and the fluorescence can be detected as artificial fluorescence from the BM-MNC. |