 |
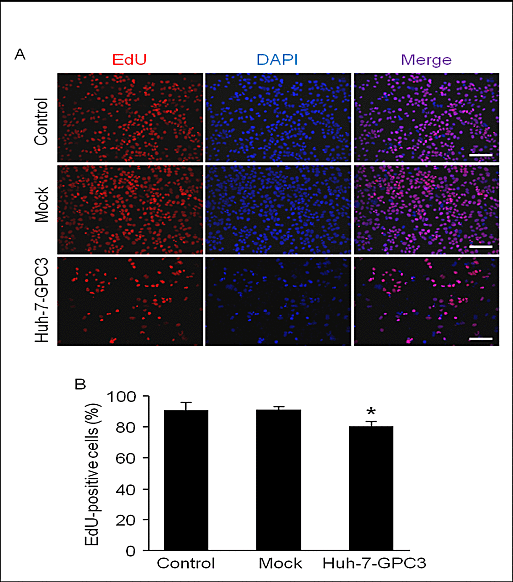
| Figure 2: Effect of GPC3 overexpression on EdU incorporation into Huh-7 cells. A: Representative images of EdU incorporation and DAPI staining in Huh-7 cells transfected with cDNA3.1 (+)- GPC3, blank plasmid (mock), or control. Scale bar: 100 μm. B: Summarized data of Edu expression in the three groups. Data was expressed as mean ± SD, n=3/group. *P<0.05, versus control or mock. |