 |
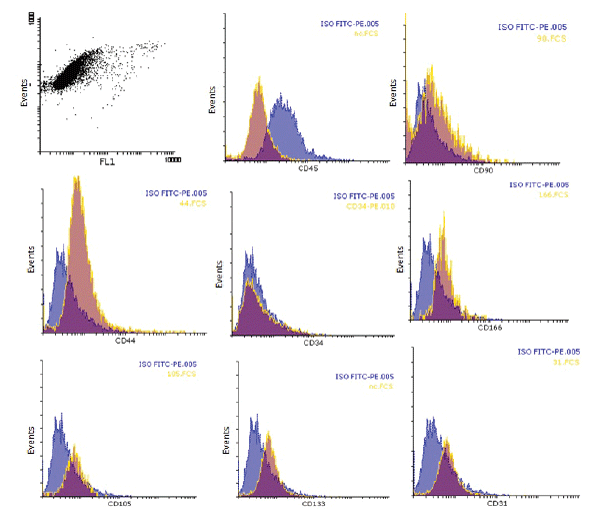
| Figure 6: Flowcytometry analysis for stem cell surface marker inun-sorted cell (group B), blue color indicates the negative area ofdiagram and brown color show that positive area. The results showthat, CD44, CD90, CD166 were positive and CD45, CD34, CD31,CD105, CD133 were negative. |