 |
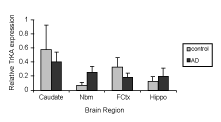
| Figure 4: Pattern of TrkA expression in tissue lysates of caudate, nbM, cortex and hippocampus obtained from AD and age-matched control brains. Steadystate levels of mRNA for TrkA were analysed densitometrically with values expressed as a ratio of ▀-actin mRNA from the same sample; data are presented as mean▒SEM. No significant differences in TrkA levels were observed between control and AD samples in any of the brain regions examined. |