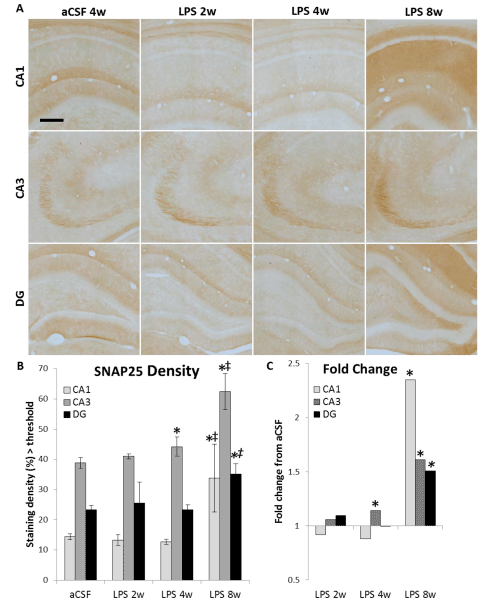
density was evaluated (B) and expressed in LPS-infused rats relative to
controls (C). Scale bar = 800 μm. There was a higher density of staining
in LPS 8w than aCSF 8w (p<0.001*) and compared to LPS 2w and LPS 4w
(p ≤ 0.015†‡). For all groups CA3>DG>CA1 (p ≤ 0.014), except aCSF 2w in
which CA3 and DG are not significantly different. SNAP25-IR increased in
the CA3 region of LPS 4w as compared to aCSF controls (p=0.004*). LPS 8w
expressed more SNAP25 in all regions than aCSF 8w (p ≤ 0.046*), in CA1
and CA3 compared to LPS 4w (p ≤ 0.031†) and compared to LPS 2w in CA1
(p=0.014).