 |
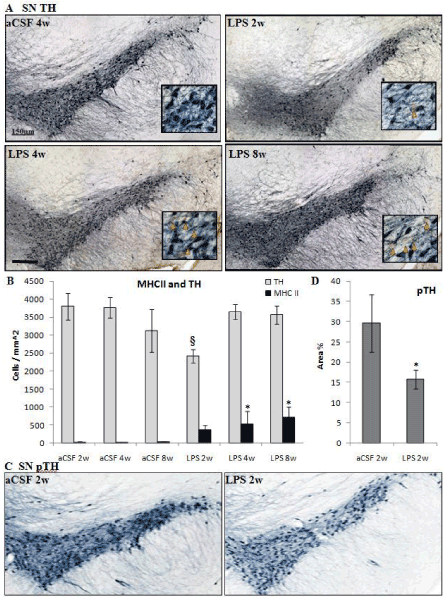
| Figure 5: Distribution of TH-IR neurons (blue) and MHC II-IR microglia (brown). (A) The SNpc (A) at 10 X with inset at 40 X (orange triangles mark the site of MHC II-IR microglia). Scale bar=150 μm. Quantification of TH in the SNpc (B) demonstrates that there is a reduction in the number of TH-IR neurons after chronic LPS infusion for 2 weeks compared to aCSF controls (p=0.025§)., but not after 4 or 8 weeks LPS infusion. MHCII-IR microglia number is increased after 4 and 8 weeks LPS infusion compared to aCSF controls (p=0.031*). There is significantly less staining density of pTH in LPS 2w than aCSF 2w (C,D p<0.025). |