 |
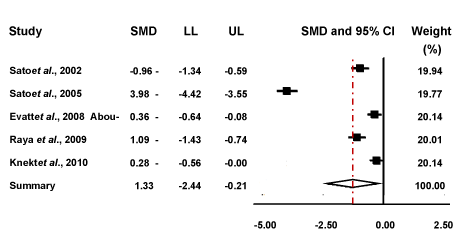
| Figure 4: Forest plot to display meta-analysis results. The forest plot demonstrates the standardised mean difference (SMD), the confidence intervals (CI), and the weighting of each study. The SMD is represented by the squares and the 95% CI is shown as the whiskers on the graph. The diamond at the bottom of the plot symbolises the pooled estimate based on the random effects model. The centre of the diamond is used to demonstrate the point estimate, and the width of the diamond represents the associated 95% CI. LL and UL represent the lower and upper limit respectively. |