 |
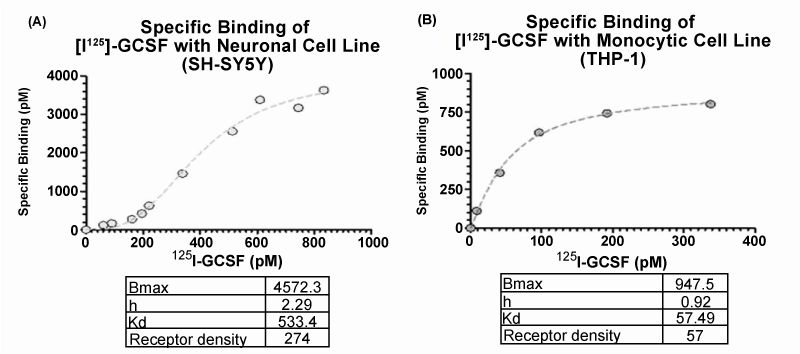
| Figure 1: The saturation binding curves for radio-labeled G-CSF in neuronal and monocytic cell lines. The results were calculated using non-linear fit and one-site specific binding with Hill slope. (A) The neuronal cell line SH-SY5Y saturation curve reveals a Kd = 533.4 pM and exhibits cooperative binding with a Hill coefficient of 2.29. The neuronal cell line calculated results are based on the mean of 4 experiments with replicates of 3 within each experiment. (B) The monocytic cell line (THP-1) saturation curve reveals a much lower Kd = 57.49 pM and a Hill coefficient of 0.92. The monocytic cell line calculated results are based on the mean of 2 experiments with replicates of 3 within each experiment. |