 |
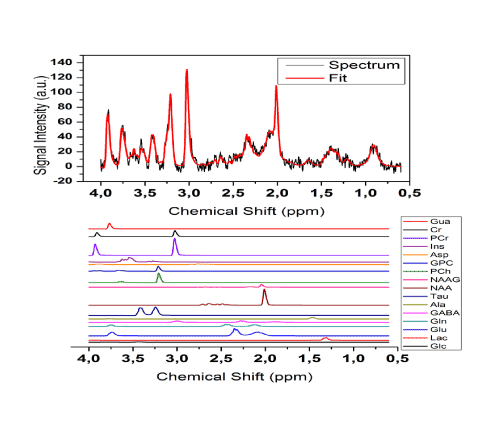
| Figure 2: A) Sagittal, coronal, and axial (from left to right) T2 weighted MR images of a mouse brain at p15 with exemplary illustration of voxel positioning in the thalamus (white). The nominal volume of MRS Voxels was (1.9 × 1.9 × 1.9) = 6.86 mm3. B) Examplary LCModel analysis (red) of a spectrum measured at p24 (black). C) Illustration of individual metabolite contributions to the fit in B). |