 |
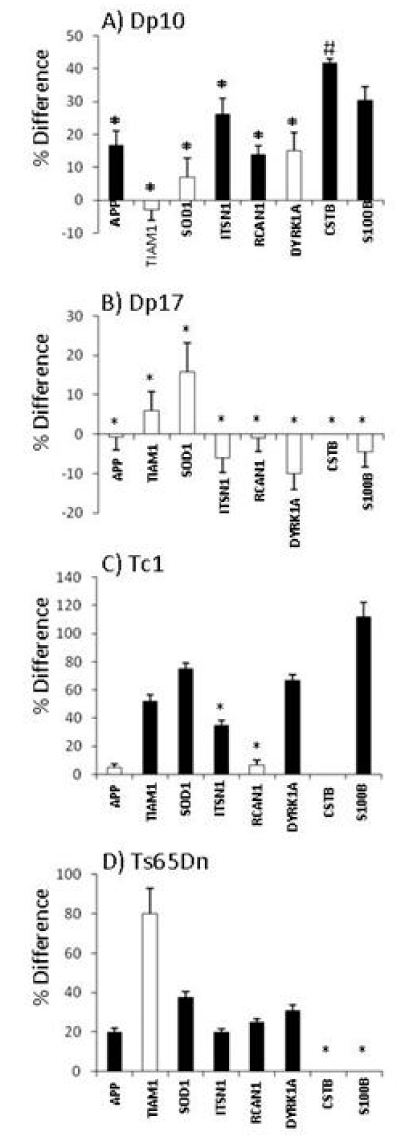
| Figure 2: Expression levels of HSA21 proteins or orthologs in hippocampus of DS mouse models. Y axis shows the % increase or decrease in protein levels in trisomic mice relative to littermate controls measured by RPPA and calculated using a three level mixed effects model. Black bars, significant change, p<0.001 (Bonferroni corrected for multiple measurements); white bars, non-significant change. Error bars indicate the SEM. All numerical values are provided in Table S3. No error bar indicates weak signals and measurements were not made. *, gene is not trisomic. #, CSTB was measured by Western blot and only in cortex of the Dp10. |