 |
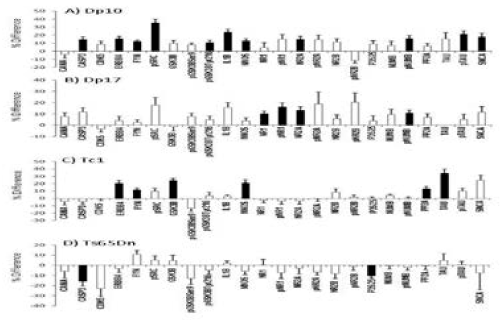
| Figure 3:Expression levels of AD-relevant proteins in hippocampus of DS mouse models. Y axis shows the % increase or decrease in protein level in trisomic mice relative to littermate controls measured by RPPA and calculated using a three levels mixed effects model. Black bars, significant change, p<0.001 (Bonferroni corrected for multiple measurements); white bars, non-significant change. Error bars indicate the SEM. Two additional proteins, BACE1 and BAD, showed no change in any model (data not shown). All numerical values are provided in Table S3. No error bar indicates weak signals and measurements were not made. |