 |
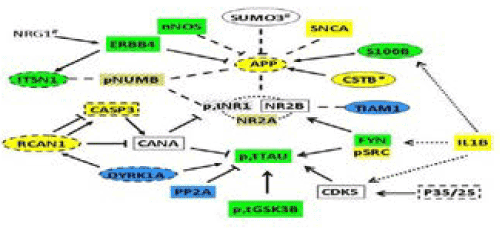
| Figure 4: Functional interactions of HSA21 and AD-relevant proteins. Interactions relevant toAPP processing, NMDAR activation and Tau phosphorylation are shown. Abnormal levels of proteins in different DS mouse models relative to corresponding littermate controls are indicated as: yellow, Dp10; blue, Tc1; green, Dp10 and Tc1; striped, Dp17; yellow striped, Dp10 and Dp17; dashed outline, Ts65Dn. No fill, no difference from controls in any model. See Figures 2 and 3 and Supplementary Table S3 for magnitude, direction and phosphorylation-specificity of changes.Ellipse, HSA21 encoded protein; rectangle, non-HSA21 protein. Solid arrow, activation; blunt line, inhibition; dashed line, protein-protein interaction; dashed arrow, indirect activation. *, measured in cortex only; #, not measured. See Table 1 and the text for references. |