 |
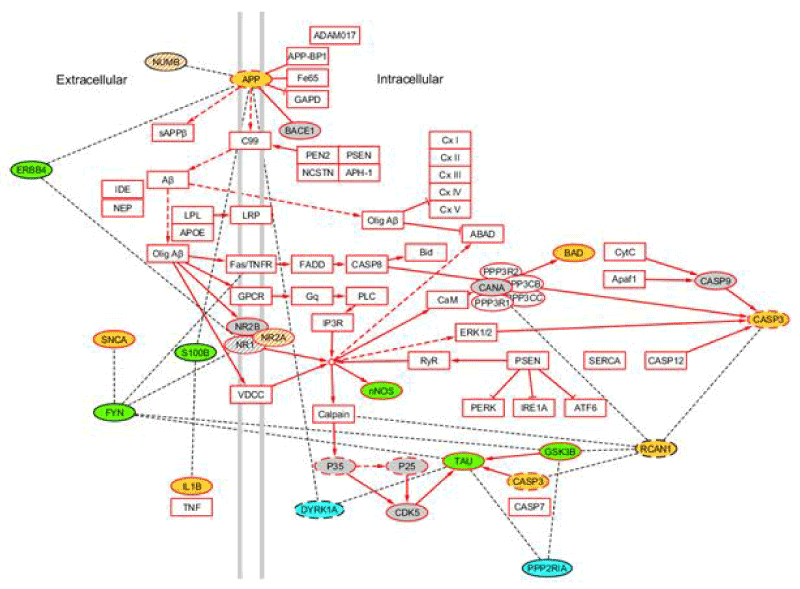
| Figure 5: Potential perturbations of the AD pathway in mouse models of AD. Components of the AD pathway imported from the KEGG database are outlined in, and their connections are indicated with, solid red lines. Complexes are indicated by their components if at least one component was measured by RPPA; otherwise the complex name is used (e.g. CaM). Primary protein interactions, retrieved from protein-protein interaction databases and filtered for shared Gene Ontology Cellular Component terms, involving proteins measured by RPPA are indicated in ovals outlined in black and connected to pathway components by dashed black lines. Pathway components and interacting proteins are color coded according to abnormalities in mouse models: yellow, Dp10; blue, Tc1; green, Dp10 and Tc1; grey striped, Dp17; yellow striped, Dp10 and Dp17; dashed outline, Ts65Dn. Grey, no difference from controls in any model. See Figures 2 and 3 and Supplementary Table S3 for magnitude and direction of changes. White, components of the AD pathway that were not measured. PPP2R1A, PP2A regulatory subunit. |