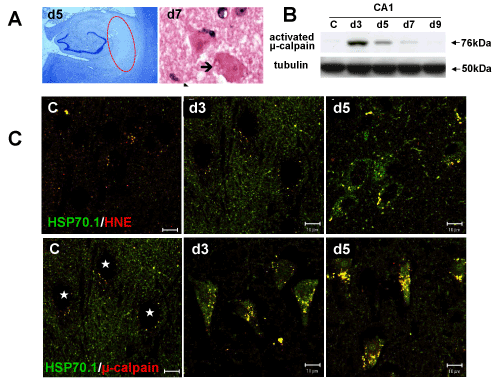
A: CA1 neuronal death is completed, showing a pallor appearance (dot red circle) on LFB staining on day 5 after ischemia/reperfusion. At the high magnification, CA1 neurons showing eosinophilic coagulation necrosis on H-E staining exhibit microvacuolatory changes on day 7 (arrows).
B: Western blotting shows a maximal activation of μ-calpain on day 3 after ischemia/reperfusion.
C: Hsp70.1, HNE and activated μ-calpain are upregulated altogether on days 3 and 5 after ischemia/reperfusion, being colocalized together.