 |
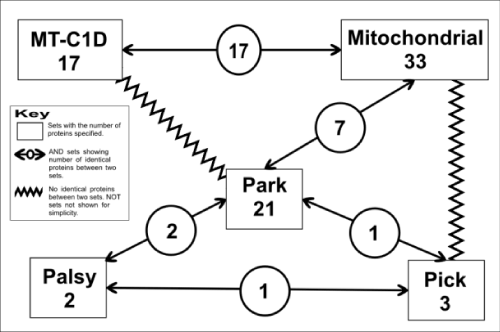
| Figure 3: Diagram showing a small portion of the PD network with two other subsets shown; Palsy and Pick. The MITOCHOND set is shown as Mitochondrial here. The arrows and circle indicate the number of proteins that the subsets have in common. The NOT sets have been omitted for simplicity but the zigzag lines emphasises these e.g. none of the MT-C1D proteins are found in the PARK set (Park). |