 |
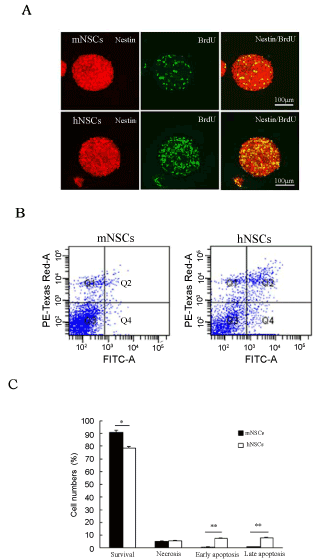
| Figure 2: Comparison of cell proliferation, survival, necrosis and apoptosis between midbrain-derived NSCs (mNSCs) and hippocampus-derived NSCs (hNSCs). (A) The mNSCs and hNSCs show distinct proliferative activity with BrdU+ incorporation; (B) The mNSCs and hNSCs show different survival and apoptosis activity indicated with flowcytometry; (C) Quantitative analysis of cell survival and cell death rate between mNSCs and hNSCs. ANOVA test: *P<0.05, ** P<0.01. |