 |
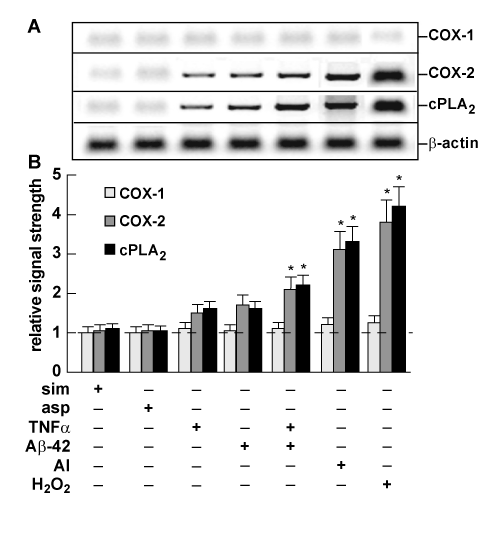
| Figure 2: Western analysis of COX-1, COX-2 and cPLA2 in stressed HNG cells - Typical results of Western analysis for COX-1, COX-2, cPLA2 and β-actin protein in HNG cells stressed with various drugs, neurotoxic amyloid peptides and trace metals, at nanomolar concentrations (see also Table 1); protein bands are shown in (A) and these results are quantified in bar graph format in (B). The relative ROS and Western signal strengths for all factors tested are represented in Table 1. For ease of comparison, a dashed horizontal line at 1.0 indicates relative signal strength for simvastatin and aspirin effects on the COX-1 signal; *p<0.05 (ANOVA). |