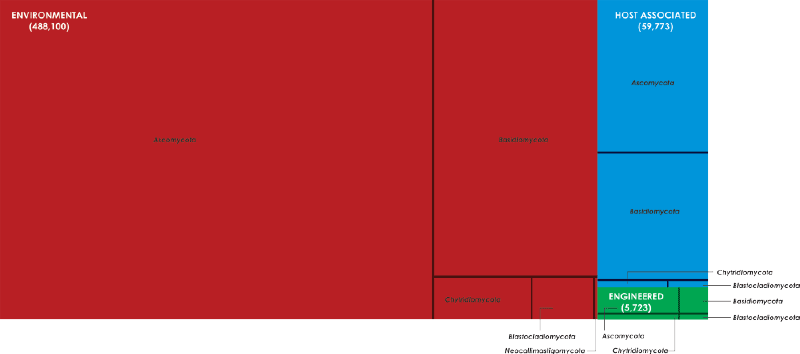
A visual representation of a data tree, where each node is displayed as a rectangle, sized and colored according to the number of sequences assigned to a given category (Environmental, Host associated, Engineered) and sub-assigned to fungal phyla. The total area of the figure is determined by the number of fungal sequences of all IMG/M [165] projects.