 |
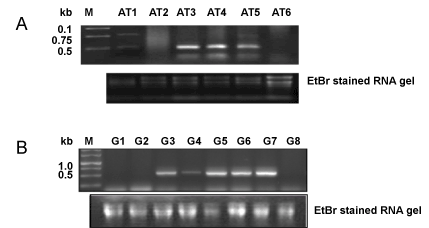
| Figure 3: Semi-quantitative RT-PCR analysis to confirm transgene expression in F. oxysporum transformed isolates obtained by: A) AMT method. M- 1 kb marker, Lanes 1-6 transformed isolates; B) Glass bead method. M- 1 kb marker, Lanes 1-8 transformed isolates. |