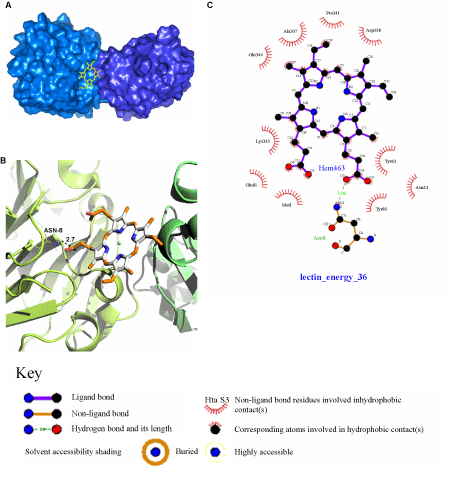
Figure 3: Docking of Hemin on the rCAL homology model. (A) Surface view of the docked hemin. Monomer in marine blue colour on the left represents the A chain while the monomer in tv_blue colour on the right represents the B chain. (B) The monomer on the left in light green colour represents the A chain, while the monomer in dark green colour on the right represents the B chain. The hydrogen bond (bond length, 2.7 Å) between hemin and ASN-8 residue of the model is represented by black dash. Oxygen atom of the side chain of ASN-8 is represented in red colour. For the hemin ligand, nitrogen atoms are shown in blue colour, hydrogen atoms in white and carbon atoms are shown in tv_orange colour. (C) Interactions between hemin and the residues on the rCAL model generated by the LIGPLOT.
Ligand bonds are shown in thick purple lines, while non-ligand bonds (i.e., belonging to those rCAL residues to which the hemin is hydrogen-bonded) are shown with thin orange bonds. Hydrogen bonds are shown by green dashed lines with the bond length printed in the middle. Hydrophobic contacts between rCAL and hemin are indicated by brick-red spoked arcs. Other atoms involved in hydrophobic contacts have spokes coming out of the individual atoms. |
