 |
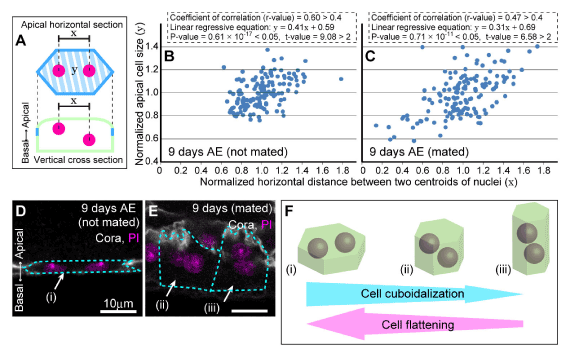
| Figure 3: The positions of two nuclei correlate with the cell shape in male accessory gland epithelium. (A) Schematic diagram of a main cell in the accessory gland, showing the horizontal distance between the two centroids of the nuclei (x) and cell size (y). En-face view of apical-horizontal section (upper) and cross-sectional view (lower) are shown. Green line and magenta circles indicate outlines of the cell and two nuclei, respectively. Blue lines indicate the apical areas labeled with anti-Cora antibody, for measuring the cell size (y). (B and C) Scatter diagrams representing the relationship of the horizontal distance between the two nuclei (x) to cell size (y). Data were collected from adult accessory glands on day 9 after eclosion (AE) without having mated (B) and 12 hours after mating (C). (D, and E) Cross-sectional views of adult main cells on day 9 AE without having mated (D) and 12 hours after mating (E), labeled with anti-Cora and PI. Arrows indicate three representatives of cells with the nuclei in various positional relationships: (i) an expanded cell, in which the two nuclei do not overlap, (ii) a moderately shrunken cell, in which the nuclei overlap, (iii) a heavily shrunken cell, in which one nucleus is layered on top of the other. Outlines of cells are indicated by dashed lines. |