 |
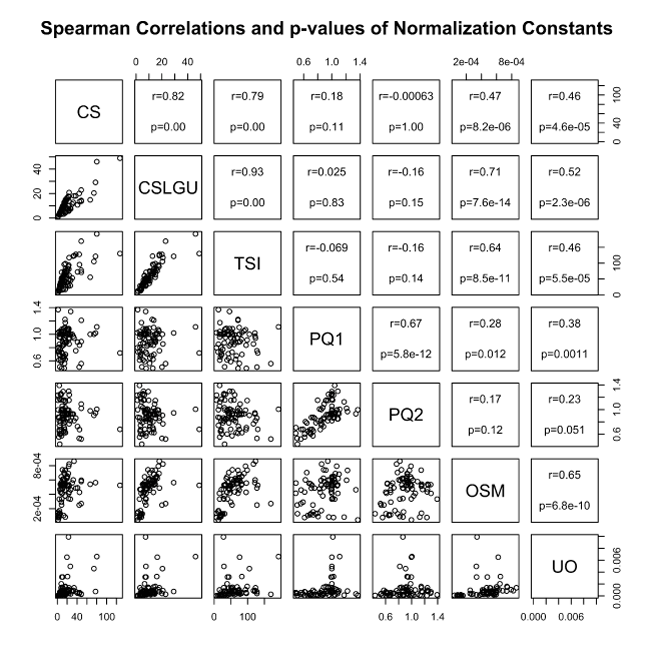
| Figure 5: Scatter plots of each of the normalization constants against each other (below diagonal) with Spearman correlation r-values and p-values (above diagonal). Scales on the plots vary with the constants as described in Figure 2: The plotting convention is as follows: the graph in the second row of the figure plots the CS normalization constants on the x-axis and the CS-LGU normalization constants on the y-axis. |