 |
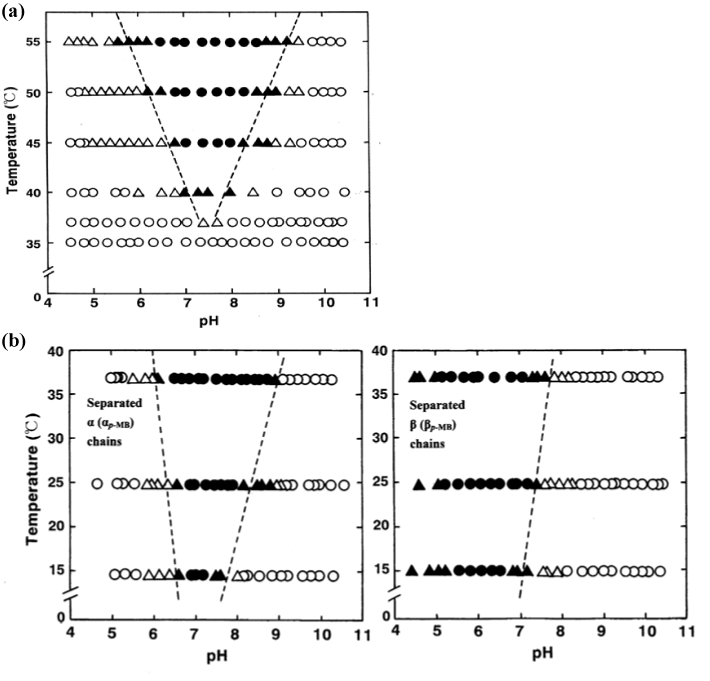
| Figure 2: Hemichrome formation associated with human HbO2 autoxidation. (a) pH−temperature diagram for HbO2 autoxidation. (b) pH−temperature diagrams for the autoxidation of isolated α and β chains. The symbols used are as follows: ●− hemichrome formation noticeable at the initial stage during the course of autoxidation; ▲− at the intermediate stage; △− at the final stage; ○− autoxidation reaction proceeded with no hemichrome formation during the entire process. |